Help for SwayStar™ (4.7.3.265)
A unique innovation is available for those individuals wishing to either make visual presentations using the graphics from the program or wishing to print documents that include graphics from the program.
Wherever the mouse is passed over a graphic image, a message automatically appears for a short time with the message: Copy (Ctrl-Shift Mouse click). Executing the command (with the left mouse click) will automatically make a copy of the graphics being displayed on-screen and hold it in the clipboard. It can easily be transferred to a graphics program (PowerPoint, Harvard Graphics, Photoshop, etc.) or inserted into a document (WORD, WordPerfect) for report writing by using Ctrl-v (paste command).
Note: When the image first appears in the imported window of your graphics program, it will be very small. You will need to enlarge it by clicking on the corners and dragging. To preserve the image proportions, if using MS PowerPoint, hold the Shift key down while dragging.
The interested user will want to explore and experiment with the options for viewing and transferring graphics.
Once the recording of a protocol has taken place, you may wish to
replay it. This is easily accomplished in the analysis window by clicking on
the replay arrow ![]() .
Stop the replay at any time by clicking on the stop replay button
.
Stop the replay at any time by clicking on the stop replay button ![]() .
Once stopped, the complete recording will automatically be reinstated in the
analysis window.
.
Once stopped, the complete recording will automatically be reinstated in the
analysis window.
These functions operate only on the upper set of pitch- / roll-time traces. To shift the zoomed display to the centre of the time plot, hold the right mouse down and drag the display to the desired position.
 It is possible to adjust
one or more records that are open so that they are scaled similarly according
to the exact wishes of user. This is useful when wishing to compare results
from different subjects, or results from the same subject over time.
It is possible to adjust
one or more records that are open so that they are scaled similarly according
to the exact wishes of user. This is useful when wishing to compare results
from different subjects, or results from the same subject over time.
User-defined analysis scaling ![]()
The scaling is accomplished by ‘selecting the icon ![]() that allows the auto-scaling to be disabled.
In this way, two graphs that have different auto-scaled images can be assigned
values equal values for more effective visual comparison.
that allows the auto-scaling to be disabled.
In this way, two graphs that have different auto-scaled images can be assigned
values equal values for more effective visual comparison.
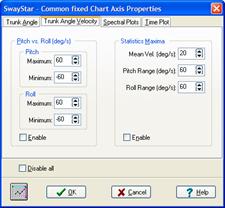
This user defined “Common Fixed Chart Axis Properties” offers several options for viewing the results. The top tabs automatically open according to the current analysis results on the monitor; however, any tab (angle, angular velocity or spectra) may be selected and altered. Simply scroll to, or type in, a new setting. In order to activate new scaling, toggle off (click on) the tick mark in the Disable all box (or press Alt + D) and toggle on (click on) the tick mark in the Enable box (or press Alt + E).
The left side of the “Common Fixed Chart Axis Properties” box selects changes for Trunk Angle (Alt + A) and Trunk Angle Velocity (Alt + V). Select the desired values to adjust and then comparing two records to which the auto-scaling had originally been applied. That is, the two graphs will now have common maximum and minimum values. The right side (Statistics Maxima) of the box simply sets the scales for the column plots; that is, area, duration, peak-to-peak values etc.
Note: To toggle a function on or off, simply click in the enable box or disable all boxes.
Window-defined current analysis scaling ![]()
Scalings in all other displayed analysis windows can be set to those
of the currently selected analysis window by selecting the icon ![]() .
.
The auto-scaling in the currently selected window is not altered. This command permits a quick comparison between displayed record.
The icon (![]() )
is selected again, to reverse the selection.
)
is selected again, to reverse the selection.
User-defined ratio split ![]()
The ratio of the split between the upper and lower analysis windows
may be changed by clicking on the adjust display ratios ![]() icon. All of the records that are open will be
adjusted to have the same display sizes for the upper and lower windows. Once
this option is chosen, it is possible to return to the original display simply
by readjusting the window (click on edges and drag to the desired size).
icon. All of the records that are open will be
adjusted to have the same display sizes for the upper and lower windows. Once
this option is chosen, it is possible to return to the original display simply
by readjusting the window (click on edges and drag to the desired size).
A normal set of reference values may be assigned or a current
assignment removed by clicking on the icon ![]() .
To keep this assignment the data must be saved. The window used to select the
reference value set is described under section
4.1.2:
Retrieve and view records.
.
To keep this assignment the data must be saved. The window used to select the
reference value set is described under section
4.1.2:
Retrieve and view records.
Labels appear on the analysis graphs. These may be toggled on or off
by clicking on ![]() in the tool bar below the recording time
window.
in the tool bar below the recording time
window.
Clicking on Window offers the opportunity to view more than one record at a time, either by tiling vertically, horizontally or cascading files. All the records may be closed at one time (Close all) or closed one at a time by clicking on the top, right-hand x of each individual record
The Window option will display 10 files.
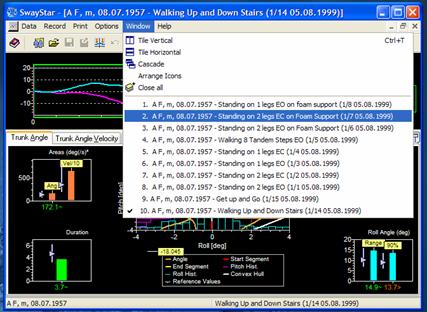
If more files are opened at one time, a List Box appears.
Note: It is important to pay attention to resource capacity. Opening too many saved records uses up resources.
This command allows the user to set the time analysis to precise values for the current data window displayed. This setting can be applied to all data windows recalled.