Help for SwayStar™ (4.7.3.265)
Two examples of the Balance Control Summary and Index, one for a patient with an acute unilateral peripheral vestibular deficit and the other of a patient suspected of simulating a balance disorder are shown below. These patients’ recordings were collected using the standard balance deficit screening sequence. More details of these patients’ case histories and examples of Summaries and Indexes for other types of patients with balance deficits are provided in section 7. How the patient’s recordings and Balance Control Summary should be interpreted as described in reference 9 in section 2.2.
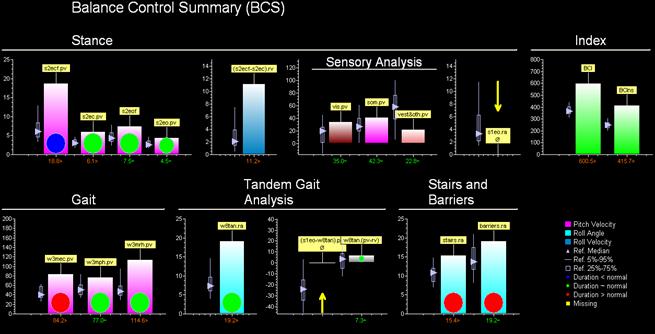
The patient is suffering from an acute unilateral vestibular loss (7.1 Case Studies). The patient’s symptoms include spontaneous nystagmus in the eye movements and a unilateral canal paresis for one ear (see section 7.1.1 for more details).
Explanation of summary symbols:
There are two types of results displayed – results of specific recordings, and composite scores such as the Sensory Analysis, Balance Control Index (BCI), and Tandem Gait Analysis.
Three types of measurements are presented, red columns for pitch velocity, and blue columns for roll angle. Green columns are used for the BCI and grey columns for the Tandem Gait Analysis, as these use a linear combination of both types of measurements. A coloured circle appears at the base of the column for a specific test. The colour of this circle is a coding for the test recording duration. Green is within the reference duration range, blue is less than normal (that is for stance or other tests a “fall” occurred) red is for greater than the reference duration, often seen when a patient needs more time to complete a gait test. Other columns show the Sensory Analysis (which is based on pitch velocity measure during four 2-legged stance tests), Balance Control Index, and Tandem Gait Analysis. On all columns the median reference value and 5 to 95 percentile limits for the variable are displayed as a triangle and a thin vertical bar. The box on the vertical bars shows the 25 to 75 percentile limits. The reference values are for an age range 5 years either side of the test person’s age. If the recording duration is less than 75% of the normal reference duration, reference values are not displayed. Furthermore, the BCI composite score can not be computed without these variables (except for the stairs test) because variables with reference values are needed for the score. Below the columns the actual numerical values of the columns are listed. These values are also colour coded: green is within the reference value range, blue is less than normal, red is for a value greater than the reference value normal.
If the subject could not perform the test a downward pointing yellow arrow replaces the column and a label indicates a zero value. In the example above, the column for s1eo (standing on one leg, eyes open) is not displayed because the subject could not complete this test. Instead an arrow is displayed. Likewise part of the Tandem Gait Analysis can not be displayed. Such arrows and labels with a zero (Ø) are also used to indicate composite scores (e.g. BCI) that could not be computed. Above each column a flag indicates the type of test and the measurement variable. For example, the top left hand column is marked s2ecf.pv (standing on 2 legs, eyes closed, foam support surface for pitch velocity).
As the stairs test often can not be completed the BCI is also computed without this test result included.
The following abbreviations are used:
s = stand (2 = 2 legs, 1 = 1 leg), ec = eyes closed, eo = eyes open, f = foam, w = walk, 3 m = 3 meters, ph = pitching head, rh = rotating head, 8tan = 8 tandem steps, pv = pich velocity, rv = roll velocity, ra = roll angle.
Description of the Balance Control Summary of the patient in the above example:
This summary contains all the elements typical for a patient with a unilateral peripheral vestibular deficit.
An inability to stand on one leg eyes open.
Ability to stand eyes closed on a normal surface but not for a normal duration on foam.
Standing eyes closed on foam or on a normal surface leads to excessive pitch velocities.
Sensory analysis for stance shows increased use of visual and somatosensory inputs.
Walking eyes closed or walking eyes open with simultaneous head rotating movements leads to excessive pitch velocities and the walking eyes closed task takes longer to complete.
Walking 8 tandem steps leads to excessive roll angles.
Walking up and down stairs and over low barriers produces large roll angles.
The BCI is greater than normal.
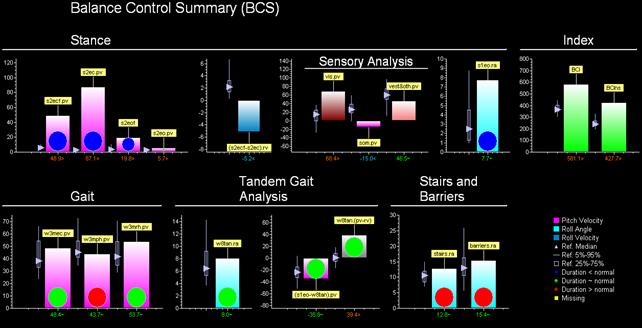
The results of this patient (see 7.4 Case studies) are typical of patients often called “simulators” or “malingerers”
Description of patient’s Balance Control Summary
The summary shows a number of inconsistencies often observed with these patients.
Pitch velocity sway values for stance on foam are less than on a firm surface, leading to a negative somatosensory component in the Sensory Analysis Graph. Sway for stance eyes closed is excessively greater than with eyes open leading to an apparently greater than normal use of visual inputs in the Sensory Analysis Graph. Roll velocity were as large eyes closed on foam as on firm support surface.
Standing on one leg without loss of balance was not possible but tandem walking could be performed within a normal time. However pitch was greater than roll velocity.
Stairs and barriers tasks were performed slowly.