Help for SwayStar™ (4.7.3.265)
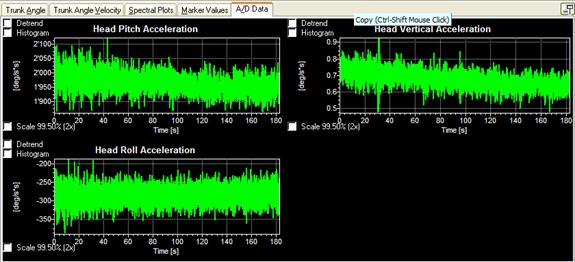
When a Data Translation A/D system is used to sample analogue signals simultaneously with SwayStar™ signals, the data is available as a tab in the data analysis window as shown below:
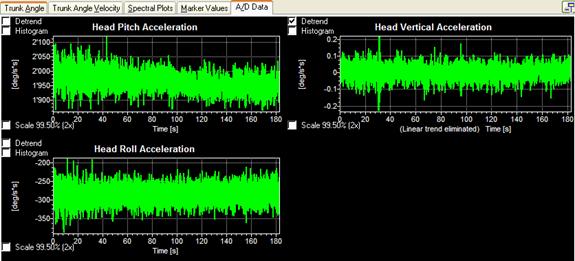
The data is automatically auto-scaled on display (the peak-to-peak values of the recording define the ordinates’ maximum and minimum values). However, the linear trend can be removed as shown:
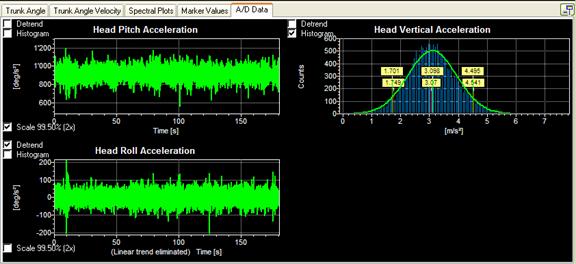
Furthermore the ordinate scaling can be changed to be a range of 2 times the 99.5% extent of the data (approximately ±5 sd). A histogram of the data can also be plotted which marks the median and 90% range of the data (see red vertical bars in the plot below) and the mean and ±1.645 sd (green bars on histogram). The green envelope trace on the histogram represents the best Gaussian probability density fit (pdf) to the sampled data. If the green and red bars overlap then the data is likely to be described by a Gaussian (or normal) pdf.
To paste streams of A/D sampled data onto the windows “Clipboard” or into an Excel file simply place the mouse on the display of the channel to be transferred and choose the option desired when the context dependent command box appears.